Analytics

How to Use Google Analytics Dashboards to Understand Your Data

JannelleChemko
ByJannelleChemko

Are you making the most out of your Google Analytics dashboards as part of your digital marketing efforts?  These dashboards create visualized summaries of different reports as widgets; they are displayed on a single page, giving you real-time, high-level access to your metrics and their performance.

Every Google Analytics account comes with a default dashboard that has a few standard widgets already included.  You can add or remove any widgets to this default dashboard, and you can create up to 20 dashboards to display your data in different formats (up to a maximum of 12 widgets per dashboard).

Google Analytics Dashboard

These dashboards are a great way to keep track of your website stats and can be very useful if you have the right data being reported in your visual summary.  To make sure you’re getting the most out of your Google Analytics dashboards, pay attention to these helpful tips.

1. Take Advantage of Shared Dashboards

Google has an awesome feature where you can import any shared dashboard templates into your own account for free!  All you have to do is find a shared dashboard that you like, click on the link while logged into your Analytics account, and choose the profile you want to add the dashboard to.  This is a really great tool that can save you time setting up your own dashboards, and boost your reporting capabilities using others’ creativity.  Econsultancy.com has this useful listing of some great templates to get you started.
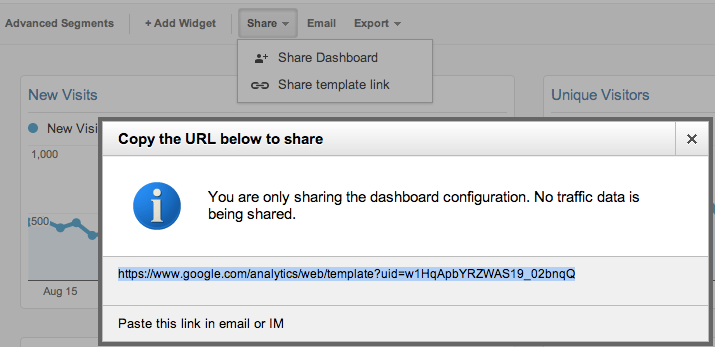
Google Analytics Dashboard Sharing

2. Separate your Dashboards 

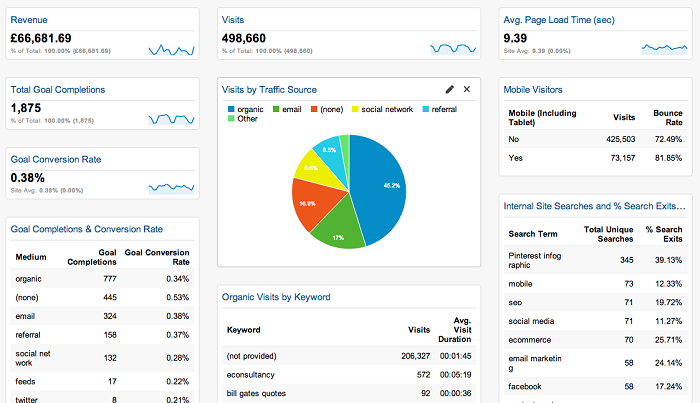
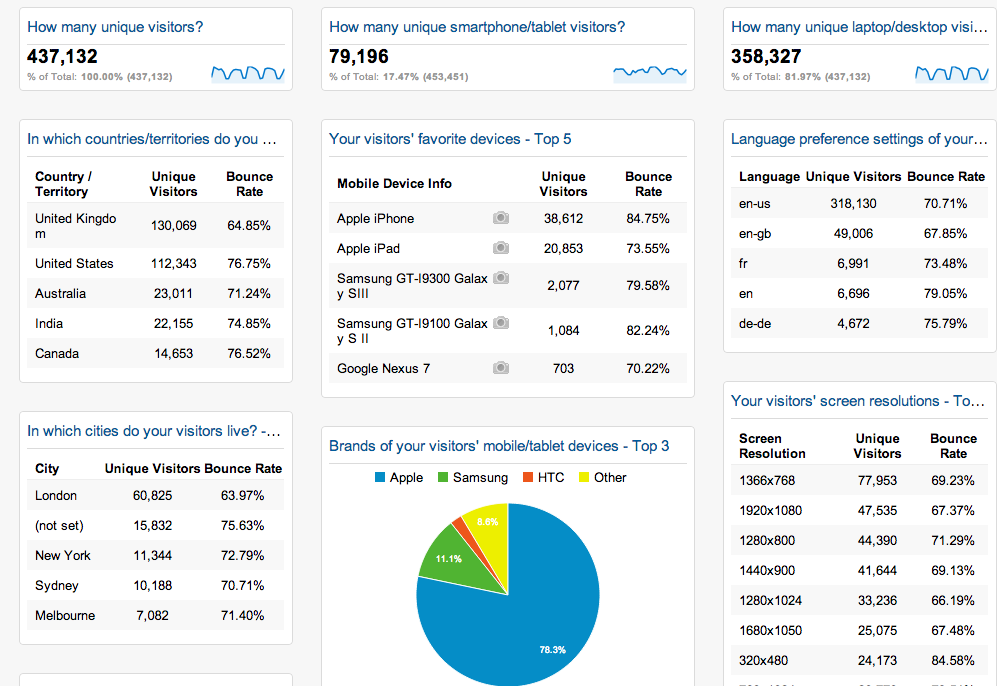
It’s a smart idea to separate your dashboards based on the information you want to pull out of them.  For example, if you want a real-time view of your Social Media Analytics, create a dashboard tailored just for this data; or, if you want to test the stats on your new mobile-friendly website, set up a new dashboard that tracks all of your Mobile Analytics.  This separation of your data allows you to pull up one of these custom dashboards and know exactly what you are looking at, and what section of your website the data is reporting on.  It’s quick, it’s easy, and readily accessible for all team members to access and understand.

Google Analytics Visitor Dashboard

3. Using Widgets

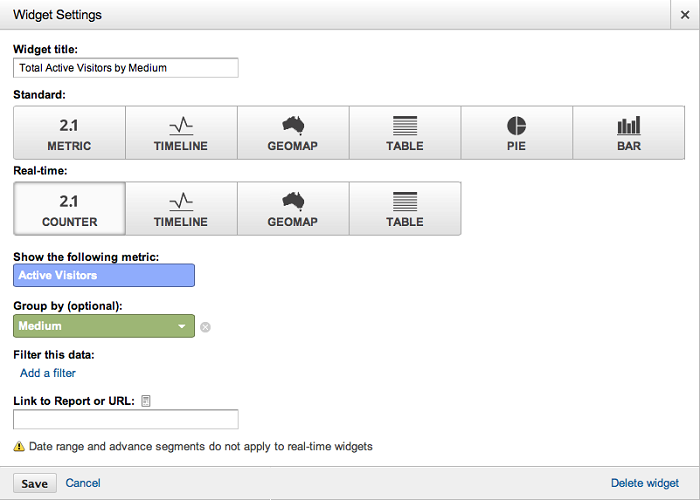
There are a number of widgets available to add to your dashboards – the trick is knowing which ones to use to get the insights you want and need.

Metric widgets: these widgets present a single piece of data on your dashboard along with a small sparkline.  This is ideal if you need to check one specific piece of data each day, like the amount of revenue generated from an online store for a certain time of day.
Timeline widgets: these widgets provide a detailed chart showing trends by day.  This widget allows you to show a single metric or compare two metrics, such as the daily number of website visits and corresponding revenue generated in the same period.
GEO map widgets: these widgets allow you to display a map within your dashboard, which can be very handy if your business is worldwide.  You can go as detailed as showing the location of your visitors, or even compare conversion rates or engagement by specific geographic location.
Table widgets: these widgets are great for monitoring PPC campaigns, landing pages or specific content.  They display a table that combines information with up to two metrics per dimension, so you can compare, for example, conversion rates between two products.
Pie widgets: these widgets are pretty self-explanatory.  The data is presented in a pie or doughnut chart and can be useful for visual comparisons.
Bar widgets: these widgets present data in a bar chart, and are very useful for visualizing comparative data.  You can edit the widget to present the data horizontally or vertically, and allows for additional customization to get the most out of the chart for your reporting.
Any one of these widgets can also have filters applied to them, allowing you to further manipulate and define what is presented in the dashboard views.
Google Analytics Widgets

4. Exporting & Emailing

There could be many people in your organization who don’t have access to your Google Analytics account, but still need access to the information your dashboards provide.  This problem is solved by Google’s ability to export any Analytics’ dashboard to PDF, excel, CSV, or into a Google Doc, or automatically send out emails with the dashboard attached.  You can set up these emails as recurring, so that they are auto-generated and emailed on a regular basis to a certain person or list of people.  This is useful for weekly/monthly or quarterly KPI reporting that you may be responsible for, and it takes one more thing off of your to-do list 🙂

If you have set up your Google Analytics account but haven’t taken advantage of the dashboard functionality, hopefully these tips will help you out.  Dashboards are a great way for you to save time on your day to day reporting, and provide real-time information as to what is going on with your website, so you can stay on top of any changing trends and benefit your business accordingly.

A couple of other great resources to help get you started with additional dashboards can be found here:

State of Digital GA Dashboards

Avinash Kaushik’s Google Analytics Solution Gallery

If you have come across any great shared dashboard templates, please leave us a comment with the details!
About the Author

JannelleChemko

JannelleChemko

Numbers Ninja & Digital Dynamo
Jannelle Chemko has been working in Operations and Accounting since 2007. After earning a Bachelor’s Degree in English, she is now in the midst of her CGA designation.

As strange as it sounds, Jannelle is a numbers and a letters guru: in addition to extensive full-cycle accounting experience in the technology and retail industries, Jannelle is also passionate about writing. In between crunching numbers and building excel reports, she researches, creates content, and keeps up to date with digital trends.

When she’s not working to meet school and month-end deadlines, you can find Jannelle outside walking her dog, and enjoying the beautiful Vancouver air.
Follow Me On: Facebook

You may also like...

By continuing to browse or by clicking “Accept” you agree to the storing of first- and third-party cookies on your device to enhance site navigation, analyze site usage, and assist in our marketing efforts.
Cookie policy | Privacy Policy

Privacy Preference Center

Close

Your Privacy

Umami Marketing Inc. appreciates your interest in its products and your visit to this website and respects the privacy and the integrity of any information that you provide us as a user of this Site. The protection of your privacy in the processing of your personal data is an important concern to which we pay special attention during our business processes.

Privacy Policy

Required
Personal data collected during visits to our websites are processed by us according to the legal provisions valid for the countries in which the websites are maintained. Our data protection policy is also based on the data protection policy applicable to Umami Marketing Inc. Read more

Cookie Policy

Required
Umami Marketing uses cookies and similar technologies, such as HTML5 web storage and local shared objects (all referred to as ‘cookies’ below), to record the preferences of users and optimize the design of its websites. They make navigation easier and increase the user-friendliness of a website. Read more

Essential cookies

These cookies are essential for websites and their features to work properly. Without these cookies, services such as the vehicle configurator may be disabled.

Cookies used

  • WordPress Required

Performance Cookies

These cookies collect information about how you use websites. Performance cookies help us, for example, to identify especially popular areas of our website. In this way, we can adapt the content of our websites more specifically to your needs and thereby improve what we offer you. These cookies do not collect personal data. Further details on how the information is collected and analyzed can be found in the section ‘Analysis of usage data’.

Cookies used

Third-party cookies

These cookies are installed by third parties, e.g. social networks. Their main purpose is to integrate social media content on our site, such as social plugins.

Third-party cookies