Google Analytics: Tracking Acquisition, Engagement, and Outcome
Over the past few weeks, you’ve followed our Step by Step Guide to setting up your first Google Analytics account, and should be receiving your first data through your reports. Data! Numbers! Statistics! Awesome…but…what does it all mean? What do you d0 now?
All of this new information can be a bit overwhelming at first: reading through the stats, trying to figure out what is relevant and what is not, and most importantly, how to use it all to make changes that will improve your website, and your business.
This post will help you to sort through all of the numbers and information and guide you towards the data that you really need. It can all be split into three core metrics: Acquisition, Engagement, and Outcomes.
What Data Should You Watch For?
Let’s start with Acquisition, or, in layman’s terms: visits. In order to build your website audience, you first need to find out who is coming to your site, where they are coming from, and what they are up to. The data provided can tell you anything from the country your visitors are coming from, how often they come to your site, how they found your site, and how they are browsing (smartphone, tablet, or computer). Google Analytics breaks down acquisition stats in a variety of views:
- Channels: how do you acquire visitors to your site? This view will allow you to compare between direct visits, referral visits, social media visits, etc.
- Keywords: which keywords or which sections of content are performing the best on your site?
- Campaigns: which campaigns are driving the most traffic to your site?
- Adwords Spend Analysis: you may be spending a lot on your Adwords budget and not understanding how to track your ROI. This view will allow you to analyze your paid marketing channels and get details on which campaigns are sending you the most traffic.
- Social Media: this section will show you all the stats on your social media accounts – which network is bringing you the most visitors, conversions, and shares, and which landing pages are most visited through which social channels.
…and a few more, but you get the gist. Measuring your site visits is the easiest piece of the analytics pie – but it’s also the smallest.
Engagement
Attracting visitors to your website is one thing, but keeping them there and getting those conversions is an entirely different thing. Once you have a better idea of who is out there visiting your site, you can more easily ensure that you reach them and fulfill their needs, by providing them what they’re looking for on a a well-optimized, usable, peak performing site.
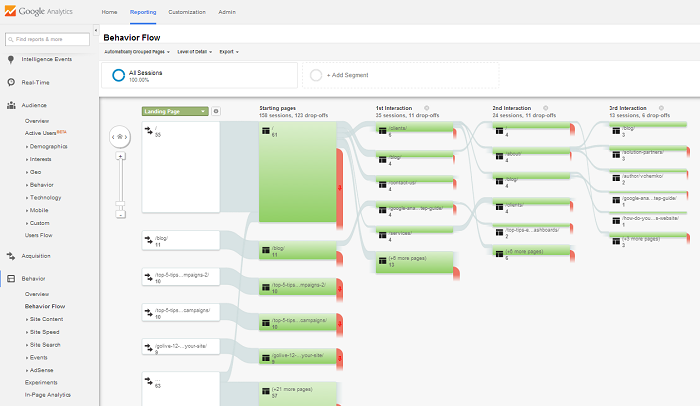
There are three actions that a site visitor can make: read the page they are on, click through your site to additional pages, or leave your website entirely. Google Analytics engagement metrics will help you track and measure these actions, and evaluate the quality and performance of your content.
There are three main metrics that track engagement in Google Analytics:
- Pages/Visit: when a visitor comes to your website, they click through an average number of pages; the more engaging your content is, the more pages your visitors will click through, looking for more.
- Average Time on Site: similarly, this metric tracks the average length of time a visitor will spend on your website, whether on a single page, or clicking through multiple pages. As a result, it’s safe to assume that the longer someone spends on your site, the more likely they found the content engaging and relevant to their needs. You can use this data to understand what keeps a visitor on your site, and also what makes visitors leave – which is extremely important information.
- Bounce Rate: this rate measures the number of visitors that leave your website directly after reaching the entry page. This can help you determine if your entry page is performing well enough to interest your visitors into clicking through further, or if they leave right after reaching your website. Doing a thorough user experience analysis will help you pinpoint any potential reasons why a visitor may leave your site, and help you fix them before they become an issue.
If you are considering making any changes to your website design or layout, this information will be the most useful for those decisions. Your entry pages need to be engaging, your content interactive, and your website user-friendly. Accurately responding to your visitors’ behavior will lead you right to the next Google Analytics metric that you need to track.
Outcome (Goals & Conversions)
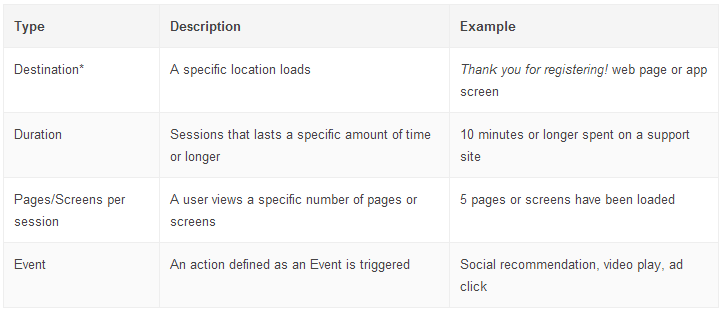
Setting goals are necessary for you to measure the performance of your website (see more on Goals & Conversions in our previous post). Google has four goal types, and each one measures a different action or event:
Every time a goal is completed, Google Analytics will log a conversion in your account; if you can assign a monetary value to each of these conversions, you can see how much these conversions are worth to your business. You can also track abandonment rates (which is the rate of visitors who fail to convert on a specific goal you’ve set up). The information provided within the Outcomes section really helps to paint a full picture of your visitors, your website performance, and how your business is tracking against its conversion targets.
UPDATE: Google Analytics has also recently updated it’s “Customer Journey to Online Purchase” tool (Dec 2014), which features refreshed data and new industry classifications, as well as detailed information regarding brand and generic paid search terms, so you can keep track of exactly which search terms are being used prior to purchase. It also has a new option to filter data by small, medium and large businesses. This tool is a great way to help you visualize the roles that all of your different marketing channels play in your customer’s journey to purchase, giving you relevant insight to make more informed decisions.
From this point, you have all of the data you need to sell and convert to your target market, and reach your goals. As you can continue to watch your trends over time, you can do more testing, adapt as needed, and then repeat, based on the insights that are provided within Google Analytics.
Which of these metrics are most important to your business, or to your role within the business? If you’re new to tracking your analytics, please let us know how it has helped you so far and what (if any) improvements you have made to your site?


