Summer can be a slow season for many industries, which can give marketing teams the opportunity to really take a look at their website content, how it’s performing, and if any improvements can and need to be made.
Google Analytics offers a number of reports that can help marketers conduct these content audits, and glean a thorough understanding of their website visitors’ experience in the process. Here’s a summary of four Google Analytics content reports that our team finds the most useful and insightful.
But first…
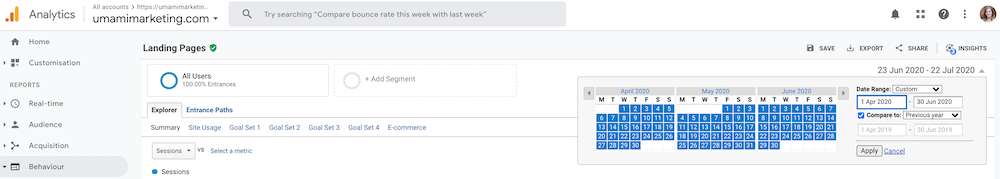
Before running these reports yourself, make sure you’re selecting an appropriate results period. We typically like to view our analytics over the last three months, or even do a comparison of the current year to the last year. Your own results may not be useful if you’re not selecting the right date range (which you can adjust in the top right corner of your analytics view):
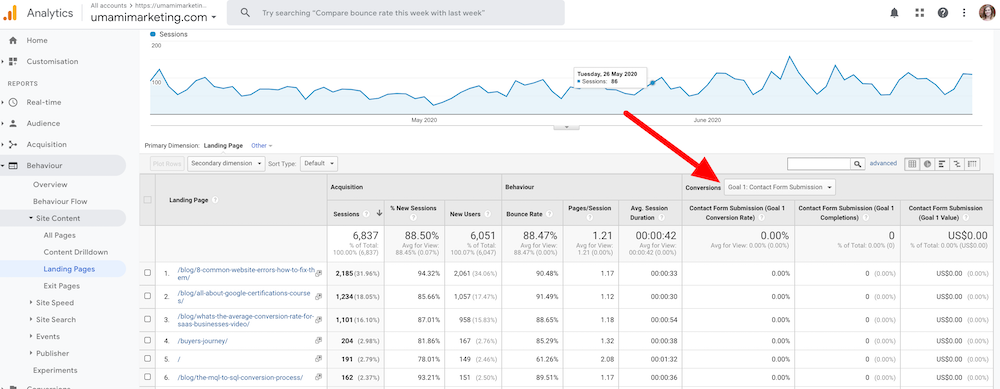
1. Landing Pages Report
Where to access it:
Reports –> Behaviour –> Site Content –> Landing Pages
How is it useful:
The Landing Pages report details where visitors are entering your site, which pages are garnering the most traffic, and which pages are converting visitors into leads.
In addition to stats about visits, there are a number of other useful metrics reported, such as:
- % New Sessions: pretty self-explanatory, but this number shows you the number of visitors who are brand new to your site, and have never visited before.
- Bounce Rate: this is a calculated % of single-page sessions where a visitor landed on the page and then left your website with no further interactions or visits to other pages. The higher the bounce rate, the more you’re going to need to look at the content on that page to figure out why your visitors are leaving.
- Pages / Session: this is the number of pages on your site that a user visits after the initial landing page. If this number is low, it may mean the content on that landing page isn’t engaging enough or doesn’t include the right CTA to encourage or entice users to visit other pages.
- Avg. Session Duration: this is the average length of time a visitor stays on your website, and isn’t a particularly useful metric on its own, but can help you gauge that page’s performance in comparison to similar pages.
If you have conversions set up within Google Analytics, you can also use this report to get an understanding as to how well each of your landing pages are converting visits into leads / customers. Check out your highest converted pages: what about them is different than lower or non-converting pages: is it the layout? Content? CTA?
2. Site Search Report
Where to access it:
Reports –> Behaviour –> Site Search –> Search Terms
How is it useful:
The Site Search reports helps you understand the extent to which users took advantage of your site’s search bar functionality (if applicable), which search terms they entered, and how effectively those search results created more engagement across your site.
Each time users search your site, they are telling you, in their own words, what they are looking for — which is a great way for you to understand user intent, and what content might be difficult to find organically on your site. Perhaps this information will tell you there is a user experience issue you need to fix, or that the keywords you’ve focused on don’t match what your audience is searching for. All great insights to help with your content audit.
3. Behaviour Flow Report
Where to access it:
Reports –> Behaviour –> Behaviour Flow
How is it useful:
What do you want to happen after a visitor accesses or consumes blog content? Perhaps take a step back and ponder exactly how you want your website content to contribute to lead generation and the overall success of your business.
The Behaviour Flow report can help shed some insight here, and show you exactly where your visitors are going after consuming one of your content pages.
But first, you need to make a few edits to the default report so it shows you the most relevant information.
Click on the settings icon next to the “Landing Page” dimension dropdown. Then edit your dimensions to only pull up the “/blog/” (or other relevant URL) expression, so the report is filtered to show behaviour flow after visiting one of your blog content pages.
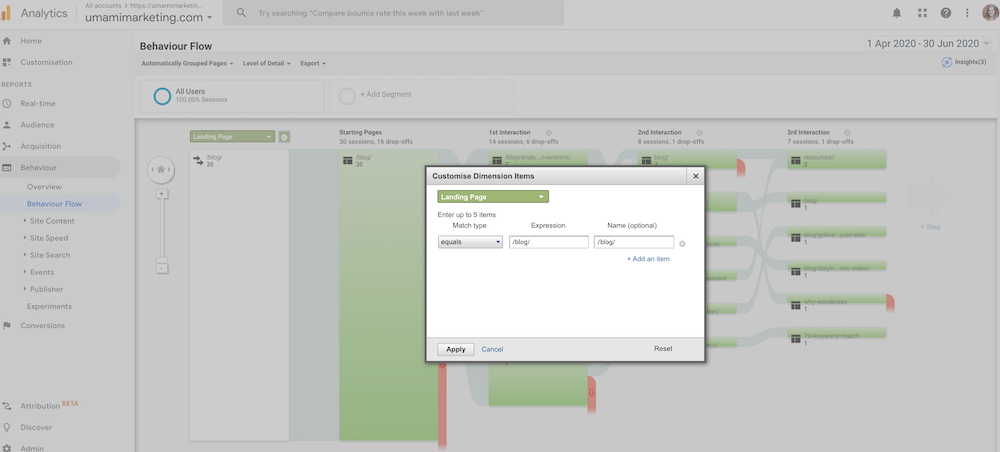
Once that filter is applied, you can see the starting and interaction page flow for a number of sessions throughout the date range you’ve selected. Pay attention to any pages in the flow report that are converting pages: for example, if a user visited a blog post, then moved to your ‘services’ page, and then to your ‘contact us’ page. Or if a user moved from a blog post to your resources section, and filled out a form to download a guide or white paper.
You can follow your user’s “flow” to find which blog posts lead to which converting pages, which may help in guiding future content creation topics and CTAs.
4. New vs. Returning / Frequency & Recency Report
Where to access it:
Reports –> Audience –> Behaviour –> New vs. Returning / Frequency & Recency
How is it useful:
We recommend using a combo of these two reports, which is why we’ve included them under one header, but we’ll break them down separately below.
The New vs. Returning report is useful depending on your content marketing goals: are you looking for growth and to build more brand awareness with new visitors, or are you looking to engage with and nurture returning visitors? This may depend on the stage of business you’re in (startup vs. established).
It’s also interesting to look at your conversions here, especially if you note that your returning visitors aren’t converting. Why would they continue to return to your site without any conversions? Brainstorm what could be impacting this behaviour: is a product sold out or unavailable? Are your returning visitors waiting for a new product? Is there some sort of user experience issue preventing them from smooth access to your product or services pages?
The Frequency & Recency report breaks your visitor session down further into the average number of sessions a particular visitor has had on your site, and the average number of days between these sessions. To make the results in this report the most useful, click on “+Add Segment” at the top, and then under the Advanced Conditions section, filter the “user type” to “Returning Visitor”.
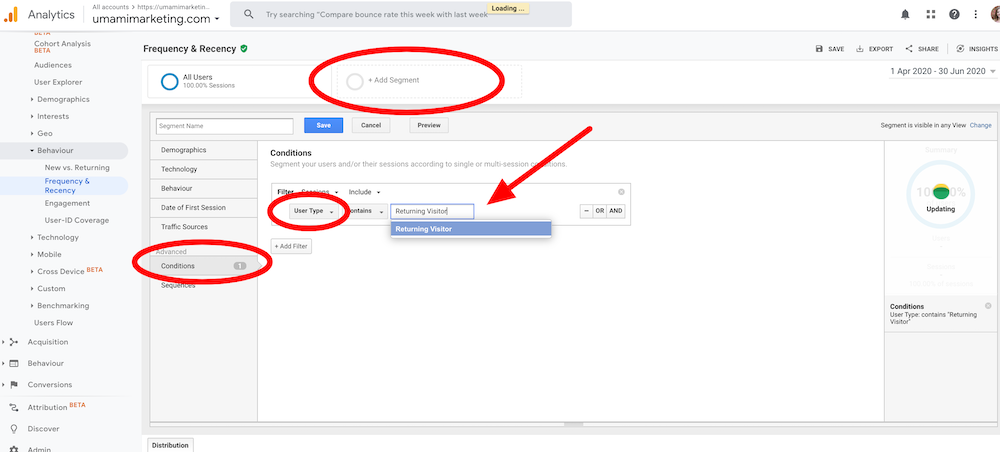
Once this segment is saved, you’ll now see results for only your returning visitors, which is really the only data you want to see here. Take a look at your “Days since last session” buckets. Do you see a spike in any of them? If you find a spike around the 16-30 day bucket, perhaps this is due to your company sending out monthly newsletters (meaning your visitors are receiving those newsletters and, as a result, clicking back through to your site). This is a positive interaction, showing your newsletters aren’t just making their way to the trash folder, and instead are enticing users to come back to your site.
Using these two reports in tandem can really help you to understand the behaviours of your new visitors and returning visitors when it comes to content consumption, and how you might make edits to your content to appeal to each of them.
—
And there you have it, our top Google Analytics reports that we access on a regular basis to help in managing our content audits and in planning our overall content strategy. There are plenty of other reports in Google Analytics that can help you understand your audience and user behaviour, you can check out descriptions of those here.
Image Credit: Markus Winkler on Unsplash
About the Author