You work hard to drive people towards your site, so you want to do everything you can to keep them there while achieving the desired outcome – whether that’s to read a blog post, submit a form, or make a purchase. But if they make a quick exit and their visit is wasted, it’s also a waste of the time, energy and money you’ve put into your site, SEO, PPC and other forms of inbound marketing.
Luckily for you, Google Analytics can help you understand exactly why and where your visitors are exiting your site. Knowing these details can help you to locate where there may be issues on your site or your landing pages, and why your visitors might be jumping ship. You can then use this information to make fixes and develop even more ways to engage with your audience.
First, you need to understand the difference between two important Analytics numbers
Exit Rate: The Exit Rate shows the % of people who left your site from a particular page. So when you look at the Exit Rate for a specific page, this is a calculation showing of the total session pageviews, how many visitors exited from that specific page. This calculation is reported for each individual page on your website.
Bounce Rate: A bounce is a single-page session on your site, such as when a user opens a single page on your site, and then leaves without navigating to any other pages. Bounce Rate % is calculated as these single-page sessions divided by all sessions. This calculation is reported for each individual page on your website, as well as the average Bounce Rate across your site.
If that isn’t clear, Google Analytics has illustrated it with this example:
Let’s explore the Exit rate and Bounce rate metrics for a series of single-session days on your site.
- Monday: Page B > Page A > Page C > Exit
- Tuesday: Page B > Exit
- Wednesday: Page A > Page C > Page B > Exit
- Thursday: Page C > Exit
- Friday: Page B > Page C > Page A > Exit
The % Exit and Bounce Rate calculations are:
Exit Rate:
- Page A: 33% (3 sessions included Page A, 1 session exited from Page A)
- Page B: 50% (4 sessions included Page B, 2 sessions exited from Page B)
- Page C: 50% (4 sessions included Page C, 2 sessions exited from Page C)
Bounce Rate:
- Page A: 0% (one session began with Page A, but that was not a single-page session, so it has no Bounce Rate)
- Page B: 33% (Bounce Rate is less than Exit Rate, because 3 sessions started with Page B, with one leading to a bounce)
- Page C: 100% (one session started with Page C, and it lead to a bounce)
Check your sites’ current bounce rates
From your Google Analytics dashboard, navigate to Behaviour > Site Content > All Pages.
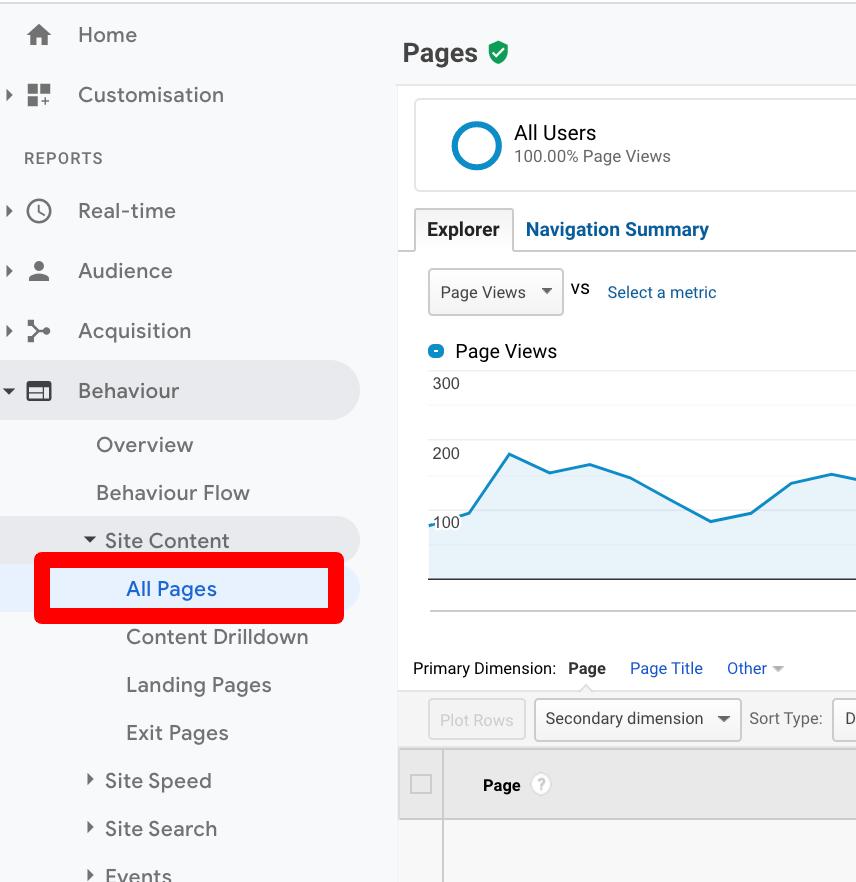
From here, you can see the calculated bounce and exit rates per page. If you change the “show rows” filter down at the bottom right, you can scroll through all of your pages. Depending on how large your business and your website are, the first 40-50 pages are typically the most relevant ones with to look at (as they have the highest page views).
Analyze pages with the highest bounce rate
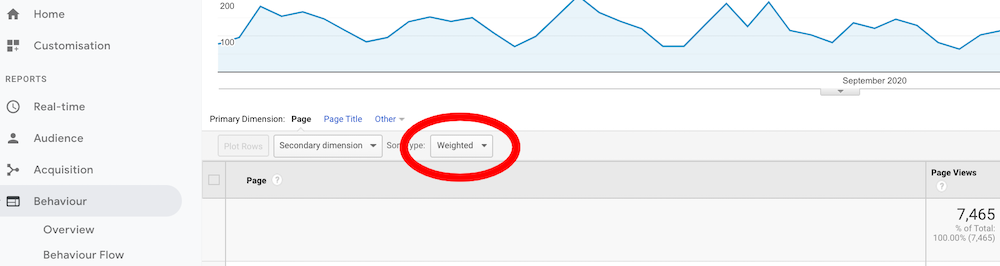
Take a look at the pages with the highest bounce rate. First, click on the bounce rate column so it sorts highest to lowest. Then under the “Sort Type” dropdown list, select “Weighted”. This will further sort the bounce rate by importance, rather than rank — meaning, it will not include any 100% bounce rates based on only 1 or 2 sessions.
If your higher bounce rates are related to blog posts, for example, it means visitors are coming to your site to look at or read that specific post, and then leaving your site right after without navigating to any other pages. If they relate to product or service pages, they are reading about your offerings and then leaving your site without taking any further action. These are issues. Ideally, you want your visitors to land on a blog post, maybe read through a few more, take a look at your products or services, and then sign up for a newsletter or download a whitepaper.
So, once you’ve got your list of pages with the highest bounce rate, visit each of them and take a closer look at what may be the reason(s) for people leaving your site.
- How are your page load times? A slow site leads to a fast exit.
- Are images or other links broken?
- Is the page loading properly on multiple devices (laptop, mobile, tablet)? Is navigation functional across all devices?
- Is the page poorly designed or too busy?
- Are you using irrelevant keywords or are your PPC landing pages incorrect? If a visitor clicks on a site on the SERPs expecting to find something relevant to their search and instead are presented with something completely different, they’ll leave right away.
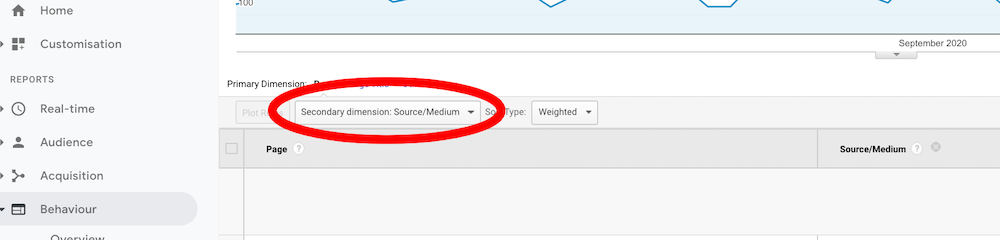
Where is your bouncing traffic coming from?
Add “Source/Medium” as a secondary dimension to your view, so that you can see where traffic is coming from for each of your pages with high bounce rates. If there is a particular source or campaign that is causing your higher bounce rates, then there’s something to investigate further. As mentioned above, perhaps your PPC campaign is using keywords that aren’t relevant to your landing page and its causing confusion.
Analyze your sites’ current exit rates
From your Google Analytics dashboard, navigate to Behaviour > Site Content > Exit Pages. Similar to the bounce rates, this report shows a list of exit rates per page. You won’t be able to apply a weighted sort in this view, but can you can filter the exit rate % to view it from the highest to lowest.
Although a page’s exit rates require some analysis just like bounce rates do, there are a few scenarios to keep in mind:
- Ecommerce sites will have exits from their checkout pages, as that means a user has completed a purchase and leaves the site.
- Exits from Contact Us or “How to Find Us” pages typically mean the user has found the information they are looking for and have contacted the business or found the address to physically visit the business.
- If you have affiliate links or campaigns, a user may follow those links and therefore, exit your site.
- Thank you pages after a form submission will have high exit rates
These are a few examples of users completing desired actions before leaving your site, in which case those exit rates shouldn’t need to be looked into.
Conclusion
It may take you some time to comb through the data for your highest bounce and exit rates, but afterwards you should have a pretty good understanding of where your issues are and what goals you want for your visitors and for each page in the future. If visitors aren’t taking the desired actions after reading your blog posts, then perhaps adjust your call to action – its placement on the page, font size, or maybe even put it on an image or graphic. A/B testing can really help you here, and monitoring feedback on two versions of a page can usually help you pinpoint exactly what the issue is and how you can fix it to achieve better engagement and better conversions.
Image credit: Michael Jasmund on Unsplash
About the Author