New ways to measure your users
One of the most beneficial ways to use Google Analytics is to track and understand user journeys across your website. Which is why they’ve introduced some new features that are focused on helping businesses “understand users so they can deliver more personalized site experiences.”
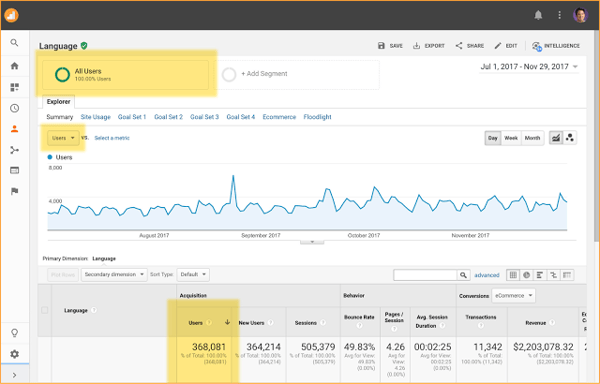
All standard Analytics reports have now been updated to report on total Users, in addition to other standard metrics like Sessions.
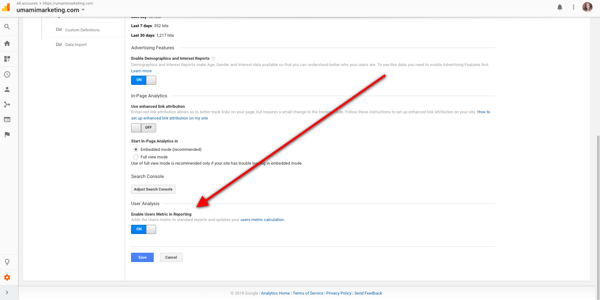
To enable this User analysis, simply go to Admin –> Property Settings, and scroll down to the bottom of the page and turn on the “Enable Users In Reporting” toggle.
To get the full benefit of this added functionality, use in conjunction with tools such as the Cohort Analysis Report, which will help you understand at exactly which point your users tend to disengage from your site, so you can use appropriate remarketing campaigns to entice them to reengage.
Updates to User Explorer
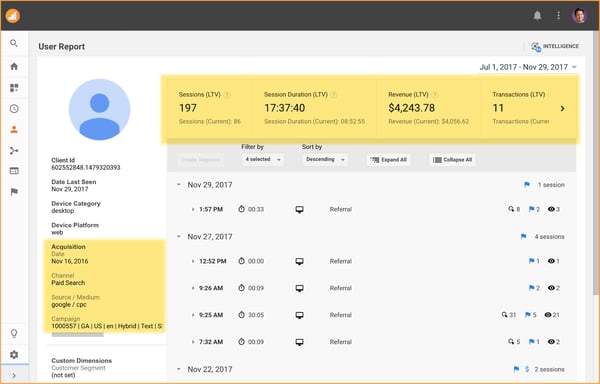
If you’re already a fan of User Explorer, you’re about to become an even bigger fan. Analytics has added new functionality to track lifetime metrics of individual users (based on the lifetime of their cookie). This feature will allow you to see at any time the total amount of time a specific individual has spent on your site, their journey across your site during all that time, and how many total transactions they’ve made. You can also see data from the beginning, showing which channel first acquired the user and the first time they visited your site.
Updates to the Audiences Report
Audiences in Analytics are users that you group together based on any combination of attributes that are meaningful to your business. For example, an audience might be simply current shoppers (those with > 0 purchases), or users who viewed a Product Detail page, and then returned within a set number of days to purchase it. Audiences are useful for targeting specific campaigns: for example, if you want to target people who have made a purchase in the last 12 months, you can group those users together into an audience and run focused AdWords campaigns specifically for that audience.
Many marketers find audiences very useful in their overall marketing strategy, so Google Analytics has added a new option to publish any audience to any new report in Analytics, so you can view acquisition, behavior and conversions data on a per-audience level.
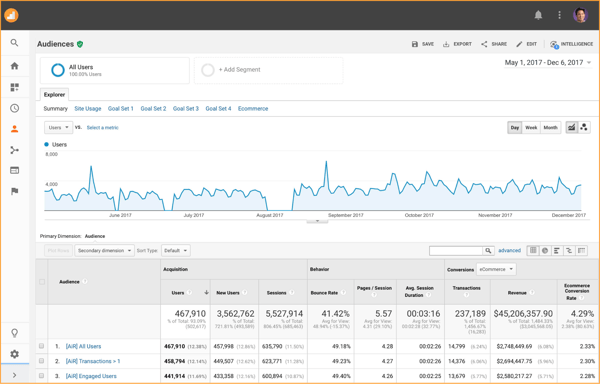
You can add multiple audiences to one report so that you can compare results and behaviors against each other. For example, it might be useful to compare audiences of those users who have made multiple purchases against those who regularly visit the site but do not complete a purchase, and the data comparison might be able to tell you why.
New metrics
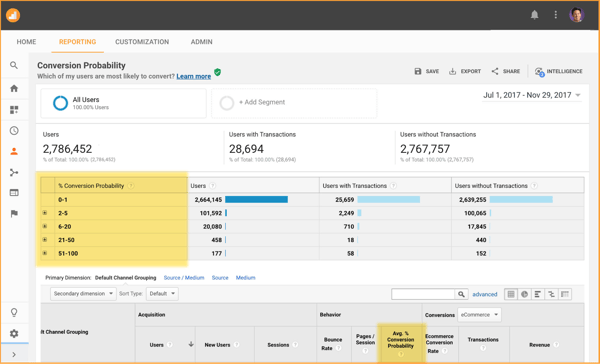
Google has also introduced a new metric: Conversion Probability, which uses machine learning to tell you the probability that a given user will convert in the future.
Using the same data modeling techniques that determine Smart Lists and Smart Goals, Analytics calculates the Conversion Probability dimension and the Average Conversion Probability metric to determine a user’s likelihood to convert during the next 30 days.
Transactions for each user are evaluated, and the resulting probability of conversion is expressed as an average score of 1-100 for all users during the date range, with 1 being the least probable and 100 being the most probable. A value of 0 indicates that the metric is not calculated for the selected time range.
The benefits of understanding this metric are potentially huge. Marketers can create remarketing campaigns to specifically target those users who are already likely to convert. Adding this metric to a new Conversion Probability Report (not yet available, but will be rolling out to all accounts over the next few months) will give you these probability numbers for all users, across each channel.
Google Analytics 360 + Salesforce Sales Cloud
Google announced their partnership with Salesforce a few months ago, and their intregration plans to “seamlessly connect sales, marketing and advertising data for the first time.”
Just last week, they announced the first of these integrations has gone live: sales pipeline data from Sales Cloud, such as leads and opportunities, can now be imported directly into Analytics 360 so that marketers can now understand a holistic view of a customer’s path to conversion, and create marketing strategies and campaigns to engage them at the right time.
It also creates new ways for marketers to understand the relationship between the original traffic source for a lead (paid search vs. organic search vs. email campaign) and how the quality of those leads may differ as they move through the sales pipeline.
So what’s next for the Google/Salesforce integration?
“Over the next few months Google will be making additional Sales Cloud data available in Analytics 360, giving marketers even more intelligence. For example:
— Product-specific data will make it possible to run remarketing campaigns that present cross-sell or up-sell offers to customers based on products previously ordered
— Data predicting the likelihood of lead conversion will let marketers create audience lists of prospects who have a high likelihood of purchasing, which can be used for remarketing (to move people along the sales funnel) or prospecting
— Lifetime value data can be used as a diagnostic tool to provide insight into which marketing channel brings in the highest value customers”
—
Hopefully these changes mean we’ll continue to see enhancements to the Google Analytics suite as they delve more into machine learning and predictive analytics, and we’re excited to see how all of these updates benefit our own business analytics here at Umami, as well as the analytics of our clients.


